2016 US Elections: PollyVote Predicts the Winner
,The current US election is getting huge attention – as the potential candidates are more polarizing than ever before. The campaigns are public feuds, fought via all available social media channels.
But: what if we could predict, quite accurately, what the outcome of the election on November 8 will be? If all the guessing could be substituted by an objective view based on a sophisticated statistical model? This is what PollyVote does: the “evidence based election forecasting model” uses multiple predictions, aggregates the data and ultimately compute a prediction on who will win the election.
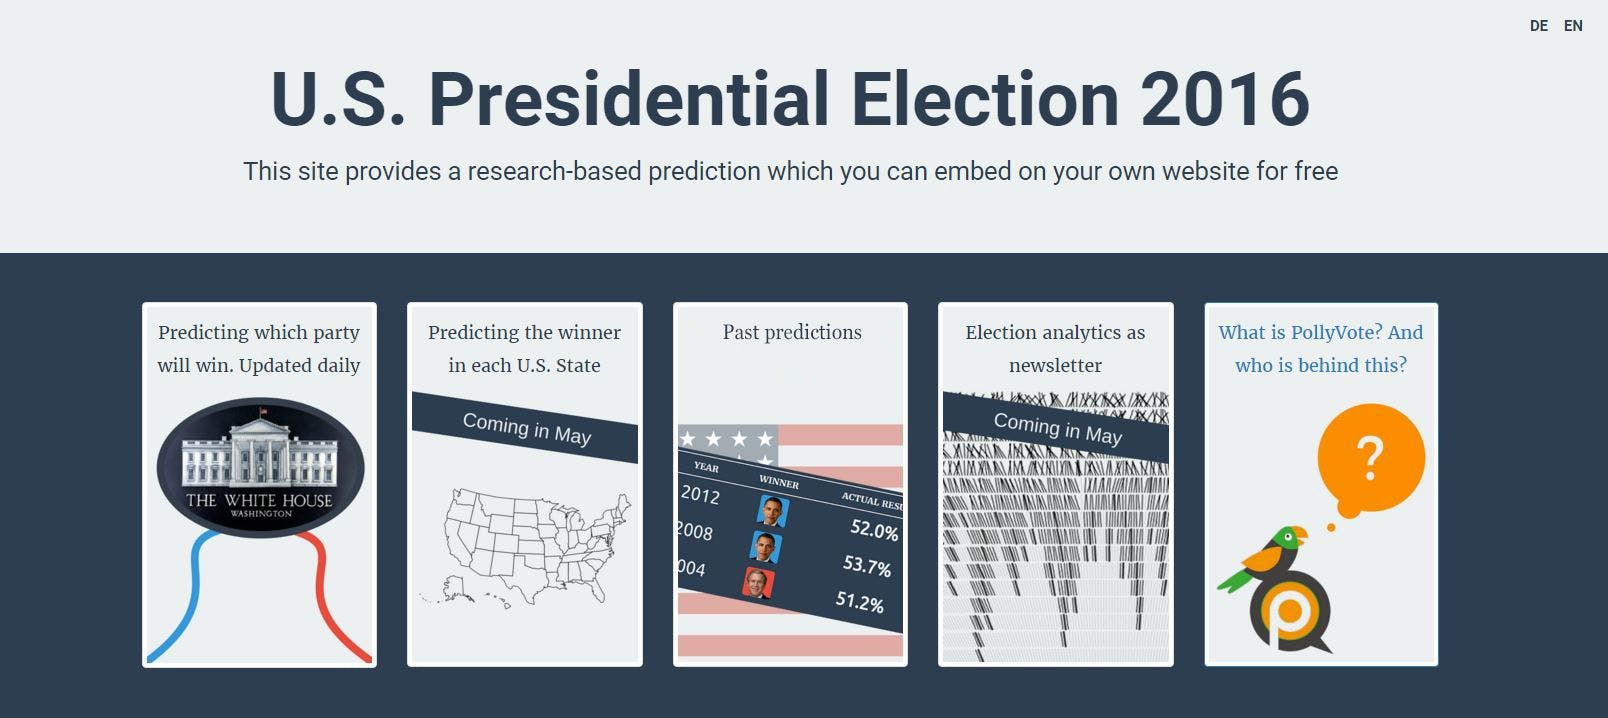
A prediction chart, free to embed
Newsrooms can benefit from prediction models in general, and this one in specific. By transforming the prediction based data in graspable and accurate charts, the complex model is now accessible and its results understandable for everyone–for journalists, bloggers, and the general public on charts.pollyvote.com.
Why is the chart free to embed, what is the motivation?
"We think that most journalists today view prediction models as a 'black box'. Only a few would trust mathematical models and their accuracy and the majority might think that robot journalism is a threat", says Mirko Lorenz, who is involved with the project on behalf of DW Innovation.
"This is why we are providing the prediction chart and an automated text analysis coming in May for free: we want to actively engage as many journalists as possible in using these data-driven technologies to enhance reporting. We are fully aware that many will be hesitant to use the prediction charts, but that is the point: after the US election we will be able to review the accurateness of the prediction. Based on how PollyVote worked for past elections the prediction is quite accurate."
What is it all about?
Research on election forecasting has made major advances over the past decade. As shown with the PollyVote for the past three U.S. presidential elections in 2004, 2008, and 2012, it is now possible to accurately predict election winners months in advance. However, due to the complexity of forecasting and the wealth of data that is required, consumers often face difficulties in understanding how predictions are generated. In order to facilitate the storytelling, the PollyVote project team developed a webpage that provides simple information and charts about the PollyVote project and forecasting. Starting in May, also regular newsletters will be provided that include automated stories based on the forecasting data (check out the first examples of this new form of robot journalism).
Who is behind it?
The webpage was developed within the scope of a project that is founded by the German non-profit organization the Volkswagen Foundation. The foundation belongs to the largest German scientific foundations and distributed 4.2 billion Euros as grants ever since it was founded. It is not directly affiliated to the present automotive Volkswagen Group.
The project's main goal is to use election forecasting as a way to bring science and journalism closer to each other. Project partners are LMU University of Munich (PollyVote), AX Semantics (robot journalism) and Deutsche Welle Innovation Projects (webpage & visualizations). For more information about the project and the PollyVote methodology, please refer to the official project website.
Help spread the word about the PollyVote prediction and its goal of providing data-driven election coverage. And do not hesitate to contact us in case of questions.