Explore Germany With Raphael
,As part of a multimedia project, Deutsche Welle has addressed the structural changes of Germany, especially after the re-unification. The project covers the topic from various angles, looks into specific sectors and offers an interesting picture of how Germany as a location for business and for industry varies in different regions.
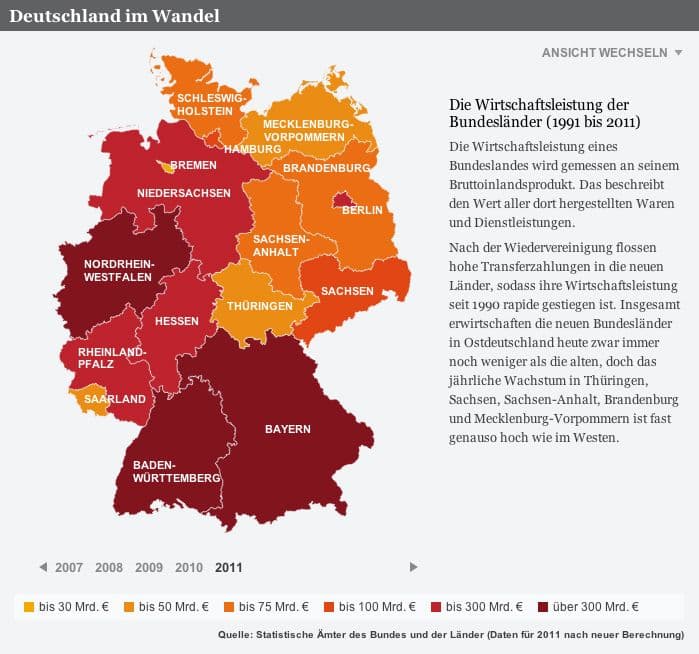
Besides interviews, picture galleries and videos, the editorial team wanted to offer a visualization that can show all the data in an interactive way in which users can understand the changes over time as well as the geographic differences.
In a collaborative effort, we scribbled down possible visualizations for depicting all the data. We discussed possible tree maps for showing specific proportions of industries, we also looked over traditional line and bar charts but very soon it became clear that a map of Germany would show the information the most suitable way. The DW Innovation team looked into innovative ways of using maps and we decided to go along with Raphael.
Scalable Vector Graphics, also known as SVG, are becoming more and more popular online. They have the advantage over pixel based images that they are resolution independent and can be generated in any modern browser. In order to create an interactive map with which you can explore background data about Germany we have used a vector based visualization library called Raphael. It generates SVGs on the fly so that you can explore Germany while focussing on selected topics, such as unemployment rates, average income and migration over time.
Fast and bandwidth friendly, because all that Raphael retrieves from our servers is the data itself.